Gergely Daroczi, organizer of the Budapest Users of R Network (BURN), recently spoke with the R Consortium about his efforts to reignite Hungary’s R community after the pandemic. With over 1,800 members, BURN is rebuilding momentum through in-person meetups and lightning talks that reconnect data professionals and R enthusiasts. Gergely also shared how he used R to integrate data from a continuous glucose monitor, dietary logs, and Strava’s API—analyzing real-time health metrics to successfully reverse type 2 diabetes and demonstrate R’s power beyond traditional analytics.

How has the group been doing since we last spoke?
I’m still trying to figure out how to restart the community after COVID impacted it so heavily. Many other meetup organizers, even those outside of the R community, have shared similar experiences. Some have managed to get back on track fairly well; for instance, I attended a few PyData conferences and the UseR! Conference this year was a great opportunity to connect with others. However, in Budapest, we are still struggling.
To provide some context, the Hungarian R meetup, known as Budapest Users of R Network (or BURN for short), has more than 1,800 members. I recently announced our first event for 2025, but attendance is not looking promising—only about 15 RSVPs so far, which is unusually low. In the past, we typically had between 50 and 80 attendees, regardless of the topic. I believe this decline reflects a general trend of reduced motivation to attend meetups.
The Meetup platform is also becoming less effective in my opinion. I’ve checked in with several contacts on Slack, LinkedIn, and other platforms, and they said they didn’t receive notifications about the new event announcement. I also tried messaging the entire group via meetup.com, as that’s the only channel I have available, but even those follow-up emails didn’t reach many people. I’ve opened a support ticket with meetup.com, and they have acknowledged the problem, but there is no ETA on a fix and no way to reach our members effectively.
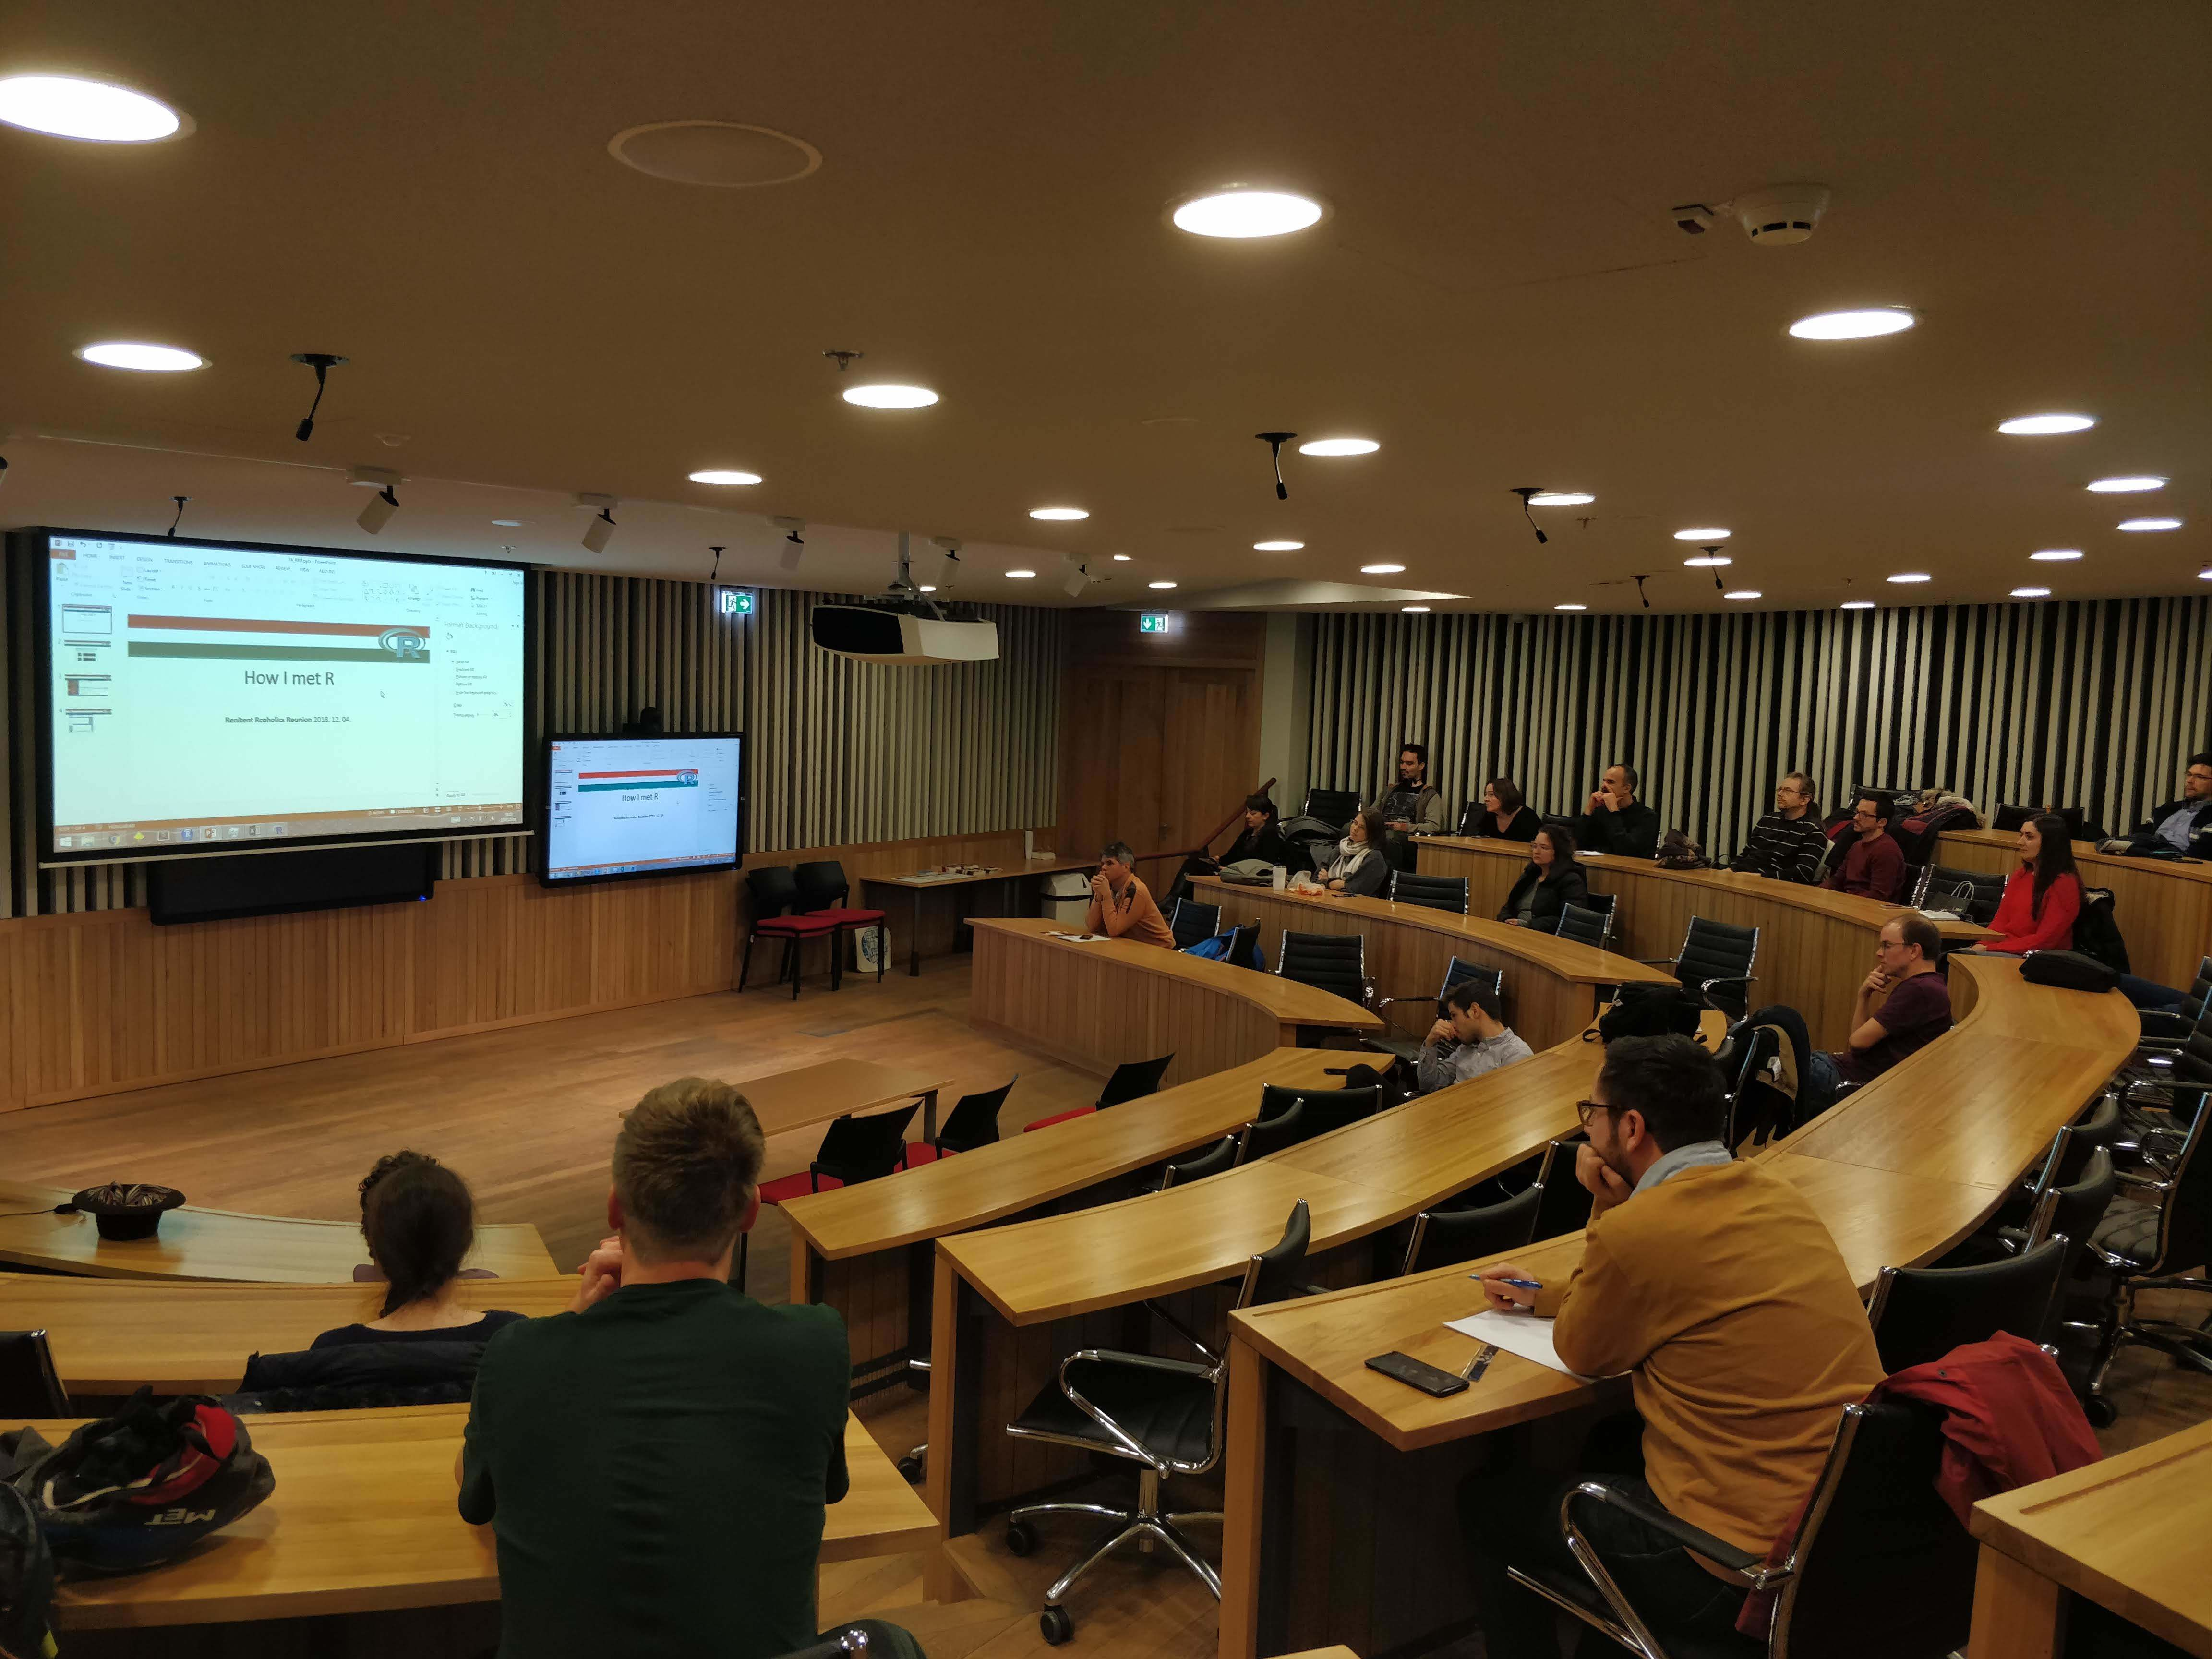
We ended up with 39 RSVPs for our recent event in November and 5 different presentations on a variety of topics. One presentation showcased a Shiny application created by a junior data scientist as part of his job application portfolio. Another talk, from a university professor, focused on her work with a static site generator using R to implement her CV and list of publications. And a well-known member of the Hungarian data community shared his insights on the global trends in the R and Python world.
I also contributed by sharing a side project where I used R to track my blood glucose levels, as I’ve been diagnosed with type 2 diabetes. I’ve been utilizing R to monitor my diet and exercise habits to develop a healthier lifestyle.
Could you provide some insights into the R community and its use over the past two years? Have you observed any significant changes during this time?
I see both favorable and less favorable trends in my experience teaching in the Business Analytics program at Central European University in Vienna. Initially, R was the primary programming language used in the program. We taught R for various applications, including building dashboards, reporting with R Markdown, and even implementing APIs. All courses relied on R.
However, two years ago, a decision was made to switch to Python. Although I continue to teach my courses in R, as I’m still convinced it is a better fit for general data analysis, they are now electives. That said, I understand the reasoning behind the shift; there is clearly more demand in the job market for Python users due to its versatility.
On the flip side, R remains incredibly powerful in several industries. For example, in sectors like bioinformatics and banking, R continues to excel. Many outstanding R packages don’t have comparable alternatives in other programming languages. It’s reassuring to see that R remains strong and continues to grow in these fields.
Please share about a project you are currently working on or have worked on in the past using the R language. Goal/reason, result, anything interesting, especially related to the industry you work in?
I was diagnosed with type 2 diabetes, which is a challenging condition. I was informed that I needed to start medication immediately because my glucose levels were extremely high. However, I consulted with another doctor who supported me in making lifestyle changes.
I decided to adopt a strict low-carb diet to help lower my glucose levels. I also started exercising daily and began using a continuous glucose monitor (CGM) to get real-time access to my glucose levels. This small device attached to my arm takes measurements every few minutes.
To track my progress, I created some R scripts that pull data points from various sources. I used an Android application to monitor my food intake, and this data is stored on a PHP-written website that unfortunately doesn’t provide an API. As a result, I had to devise creative methods to extract this data. I documented the process in a LinkedIn post, detailing how I tracked my caloric and carbohydrate intake throughout the day.
In addition to my food data, I accessed the CGM data on my phone. I installed open-source software that synced all the collected data points to an InfluxDB, another open-source database that I set up on one of my servers. I also integrated my old elliptical trainer, which uses a proprietary Android application. Fortunately, I found someone who reverse-engineered the protocol, allowing me to sync that data to Strava. Strava offers a free API, even for its free plan, allowing me to obtain the data and run daily reports.
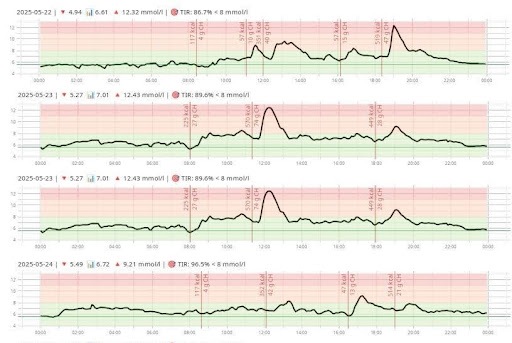
These reports help me understand how my glucose levels fluctuate throughout the day, how different foods affect my levels, how I can manage spikes through exercise, and how to structure my day effectively. I’ve received regular feedback on how my body responds, which has been incredibly helpful.
On these charts, the black line represents my actual glucose levels, as measured. The vertical red lines indicate my energy and carb intake, and the gray intervals show the periods when I was exercising on the elliptical trainer.
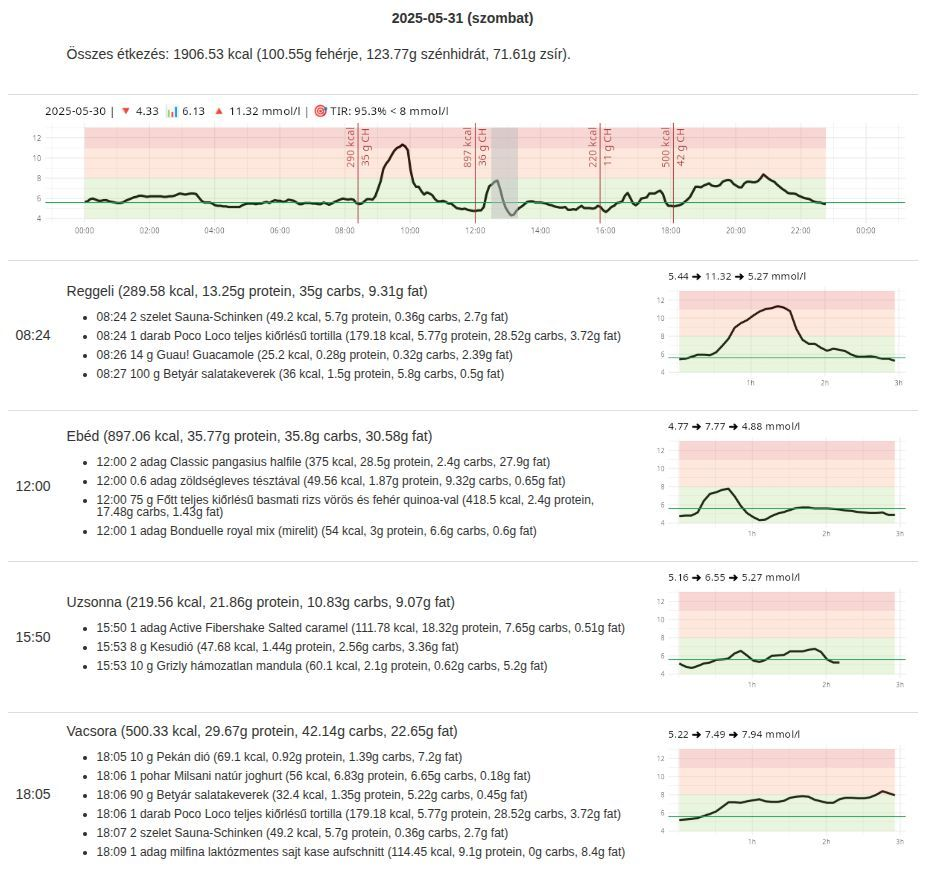
I observed that my glucose levels fluctuated, with occasional spikes that were concerning. My goal was to maintain my glucose levels within the green zone, which represents a healthy range, while keeping them as low as possible when they approached the orange or red zones, indicating unhealthy levels. This feedback was instrumental in helping me attain a healthy state.
After four months, I shared an update along with my lab results, which indicated that over the past quarter, I had been 100% healthy, with normal glucose levels. Achieving this required significant changes to my diet, such as reducing carbohydrate intake and committing to regular exercise. I accomplished this without medication, mainly because of the empirical data I collected and the instant feedback it provided.
Overall, this experience was like a data analysis project, aimed at maximizing my health outcomes. I found R to be an invaluable tool for consolidating these data points, enabling me to track and improve my health.
How do I Build an R User Group?
R Consortium’s R User Group and Small Conference Support Program (RUGS) provides grants to help R groups organize, share information, and support each other worldwide. We have given grants over the past four years, encompassing over 82,000 members in almost 100 user groups in 41 countries. We would like to include you! Cash grants and meetup.com accounts are awarded based on the intended use of the funds and the amount of money available to distribute